Connecticut Traffic Stops Data Repository
Data Table
Use the tools below to explore traffic stop data from October 2013 through December 2023. Click here to learn more about the data and the categories displayed in the tool.
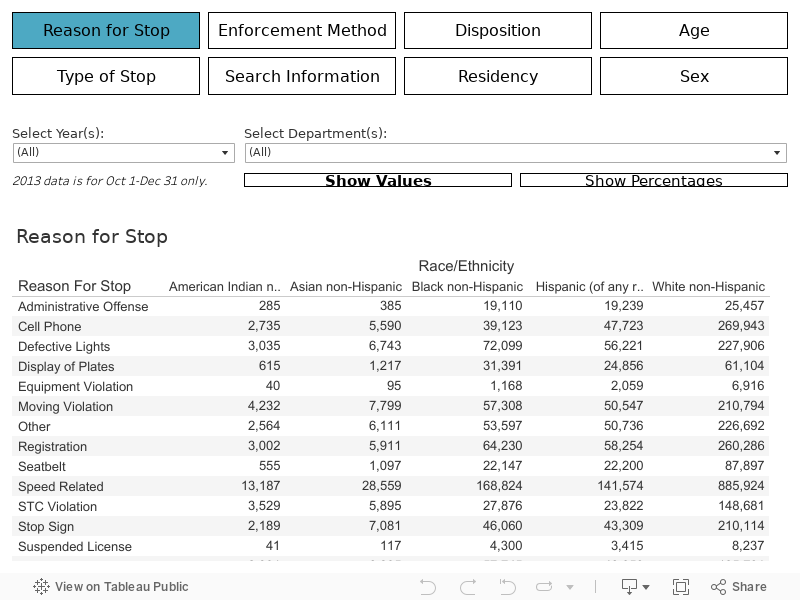
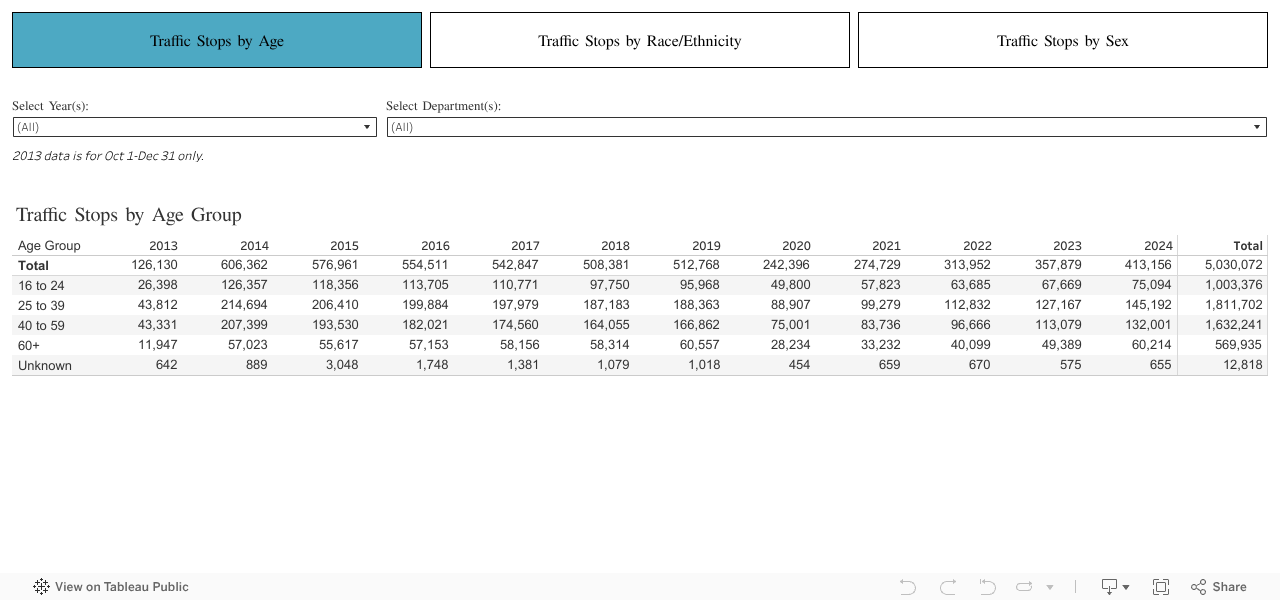
The first table on this page includes the total number of traffic stops by age group, race and ethnicity, and sex. The second dashboard includes traffic stop data by race and ethnicity for different categories. Both tables can be filtered by year and department.
Traffic Stop Totals
Using the checkboxes, select one or multiple years. Selecting “All” will include all years of data. Once a selection is made, the table will update to include data from all selected years.
Using the checkboxes, select one or multiple departments. Selecting “All” will include all departments. Once a selection is made, the table will update to include data from all selected departments.
Traffic Stop Data by Race/Ethnicity
Select a category of interest: Reason for Stop, Enforcement Method, Disposition, Age, Type of Stop, Search Information, Residency, or Sex.
Using the checkboxes, select one or multiple years. Selecting “All” will include all years of data. Once a selection is made, the table will update to include data from all selected years.
Using the checkboxes, select one or multiple departments. Selecting “All” will include all departments. Once a selection is made, the table will update to include data from all selected departments.
The default view shows counts for the selected category, year(s), and department(s). You may also view percentages by clicking the “Show Percentages” button.