
New Connecticut Census Data Shows: Increase in Diversity, More Residents Insured, But Minimal Population Change
The American Community Survey (ACS) is administered by the United States Census Bureau on an ongoing basis, from January through December of every year. The Census Bureau released the 2019 ACS 5-Year survey data on December 10, 2020. In this blog post, we summarize important, high-level findings for the state of Connecticut. Additionally, we have created an interactive platform for you to explore the data further.
Overall Population in Connecticut
The estimated population in Connecticut is 3.57 million, a decrease of 0.5% from 3.59 million in 2014. The largest decreases were experienced by Cornwall (-14%), Franklin (-11%), and Hartland (-10%), while Chaplin (+10%), Norfolk (+10%), and Lyme (+6%) saw the largest increases. The ten largest towns in 2014 remained the largest towns in 2019, and the majority of smallest towns remained the same.
Racial and Cultural Diversity in Connecticut
Nearly one-third (33%) of Connecticut residents are persons of color (this includes white residents who are multi-racial), an increase of 3% from 2014. Hartford remains the town with the highest percentage of persons of color (85%), followed by Bridgeport (80%) and New Haven (71%). Additionally, a large percentage of Hartford, Bridgeport, and New Haven residents speak a language other than English at home (43%, 49%, and 36%, respectively).
By contrast, Woodstock and Killingworth have become less racially diverse. In Woodstock, the population of color has decreased from 6% to 2%, and in Killingworth, that population has decreased from 8% to 3%.
How Old Are Connecticut Residents?
The median age of residents in Connecticut is 41.0, slightly up from 40.3 in 2014. Thirty-seven towns experienced a decrease in median age, 128 towns experienced an increase in median age, and four towns saw no change. Towns with large universities nearby have a lower median age, such as Mansfield (which contains the largest campus of the University of Connecticut) with a median age of 21, whereas towns that have historically had a larger retiree population have a higher median age, such as Essex with a median age of 55.
What is the Income Level of Connecticut Residents?
Connecticut’s median household income increased by 12%, from $69,899 in 2014 to $78,444 in 2019. Of Connecticut’s 169 towns, 151 experienced an increase in median income and 18 experienced a decrease. The median income increased the most in Westport, from $151,771 to $206,466 (+36%).
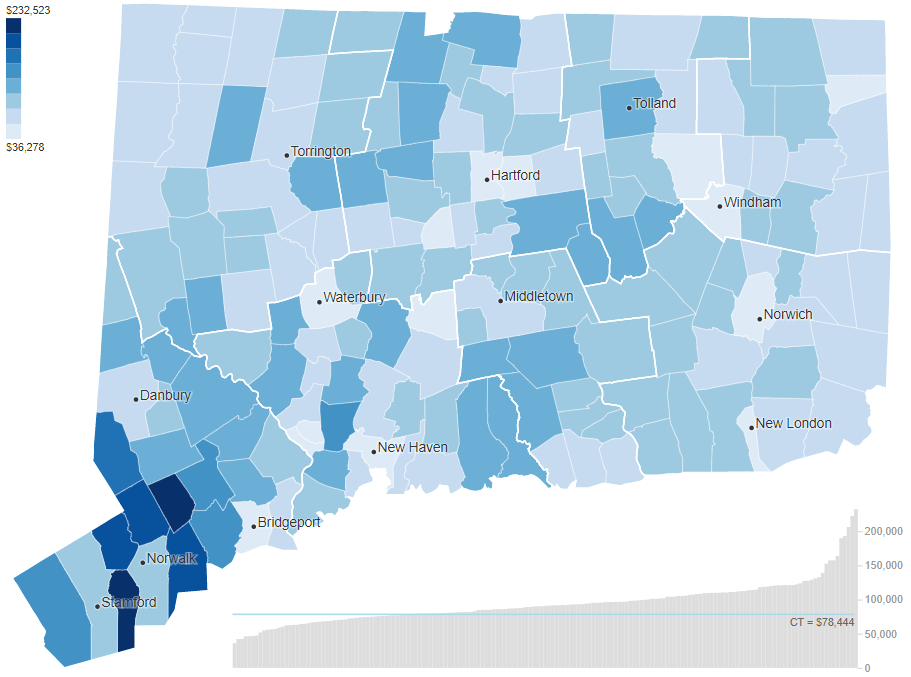
This map shows median household income for all towns in Connecticut, according to 2019 ACS estimates. Darker blues represent higher values. View interactive version here.
The towns with the highest median household income overall (exceeding $200,000) include Darien, Weston, and Westport. Towns with the lowest median household income (below $45,000) include Hartford, New Haven, and Waterbury.
Additionally, when comparing median household income to the Consumer Price Index (CPI) increase of 9% from 2014 to 2019, about one-third of towns experienced a change in household income below the estimated CPI increase. In other words, about one-third of Connecticut households were not able to increase their income enough to keep pace with the increase in prices paid for goods and services.
On the individual level, per capita income in Connecticut increased by 16%, from $38,480 to $44,496. Similar to household income, Darien, Weston, and Westport, along with New Canaan and Greenwich have the highest per capita incomes, exceeding $100,000. All but seven towns experienced an increase in per capita income.
Educational Attainment in Connecticut
Among all Connecticut residents aged 25 and older, 91% have obtained at least a high school degree (or equivalent), compared to 90% in 2014. Among the same group, 39% have obtained at least a Bachelor’s degree, compared to 37% in 2014.
Trends in educational attainment are similar to those of household income—83% of residents in Darien, 80% in New Canaan, and 78% in Weston have obtained at least a Bachelor’s degree, whereas only 16% in Waterbury and 17% in Hartford have done so.
How Many Connecticut Residents Are Uninsured?
The number of residents in Connecticut were not enrolled in a health insurance plan has decreased from 9% to 5%. The percentage of uninsured residents decreased in 151 towns, remained the same in two towns, and slightly increased in just 13 towns. Westbrook, Willington, and Canterbury reduced the number of uninsured residents considerably, from over 10% uninsured in 2014 to between 1-3% in 2019.

Top 10 towns with highest decrease in the uninsured population. This table shows population without health insurance by town for two survey releases, ACS 2014 (covering 2010–2014) and ACS 2019 (2015–2019), along with change over time. View interactive version here.
Home Values in Connecticut
Across Connecticut, there has always been a drastic disparity in home values and 2019 is no different. Homes values in Darien, New Canaan, Greenwich, and Westport are over $1,000,000, while home values in towns such as New Britain and Windham are well under $200,000.
Overall, home values have stayed relatively consistent, with a median home value of $275,400, compared to $274,500 in 2014. Some towns experienced favorable increases in home value, such as Lyme (+21%), Canaan (+17%), and Sprague (+13%), while others saw a steep drop, such as Sharon (-20%), Washington (-16%), and Griswold (-15%).
Please note towns with home values above $1,000,000 were reported as $1,000,000+ rather than the exact number in 2014; therefore, increases/decreases cannot be accurately calculated for these towns. Additionally, it is important to note that homeowners tend to overestimate the worth of their home (see our Connecticut Housing Portal to explore housing data).
How Much Are Connecticut Renters Paying Each Month?
A typical Connecticut renter pays $1,180 monthly for rent, compared to $1,069 in 2014 (12% increase). Consistent with home values, median rent in towns such as Weston, Darien, and Wilton are over $2,000, while median rent is lowest in Franklin ($698), Andover ($821), and Haddam ($870). Changes in rent vary vastly from town to town—Bethlehem and Wolcott saw an increase in rent of over 50% while Franklin saw a 58% decrease.
Similar to home values, please note towns with median rent above $2,000 were reported as $2,000+ rather than the exact number in 2014; therefore, increases/decreases cannot be accurately calculated for these towns.

This map shows median gross rent for all towns in Connecticut, according to 2019 ACS estimates. Darker blues represent higher values. View interactive version here.
What Next?
Annual releases of the ACS are crucial to understanding how Connecticut is evolving, both as a whole and on the town level. ACS data helps leaders and policymakers in Connecticut make informed decisions around income, housing, education, and more. To further explore the ACS 2019 data, please visit our interactive platform here.
To learn more about the Census and resources provided by CTData, head to our Census Data portal. Explore other data sets and analysis at data by topic and data projects. Access our Geospatial Tools or Census Data Tools for your own census data project. You can stay up-to-date on the latest data and tools by subscribing to our newsletter and following CTData on Facebook, Twitter, and LinkedIn.