
Income in Connecticut: The Source Shapes the Story – Part II, Unemployment
This is the second piece of a four-part series about data literacy and critical data consumerism through the lens of economic prosperity. You can read Part 1 here.
In this series, we explore four variables associated with economic prosperity through the lens of different data sources: Income, unemployment, student loan payments, and mortgage interest payments. As you will see, each data source paints a slightly different picture of the state depending on how the question was asked, the data source, and the respondent population. We hope that through this series you will be reminded that we must all continue to be curious about the information we are presented with and work to be critical consumers of data in our everyday lives.
The analyses in this series were completed by our Fall 2019 Wesleyan Intern, Spencer Arnold. We are grateful for his contribution toward and enthusiasm for this project.
Part 2: Unemployment
A key concern related to a state’s economic development and prosperity is the unemployment rate. Like income from Part 1 of this series, multiple agencies and reporting methods are used to track unemployment. These include the American Community Survey, IRS Form 1040, and the Connecticut Department of Labor’s Local Area Unemployment Statistics (LAUS). To understand the broader picture of Connecticut’s economic development, it is important to grasp the nuances of these different data sources.
Data sources
American Community Survey
The American Community Survey (ACS) is an ongoing survey product of the U.S. Census Bureau that collects detailed information about the population in our country. Questions cover many topics, including: educational attainment, employment status, income and earnings, industry and occupation, health insurance coverage, housing characteristics, and demographics. ACS data is widely used by planners, policymakers, and organizations to help communities plan for programs, businesses, and services to meet the needs of their residents.
IRS Form 1040
The U.S. Department of Internal Revenue Services collects annual income tax returns from taxpayers using Form 1040. IRS Form 1040 also captures deductions for government assistance programs such as unemployment.
CT Department of Labor LAUS
The CT Department of Labor (CT DOL) collects data collects a wealth of information about the state’s labor market, including unemployment, wages, occupations, industry sector, and higher education. The LAUS program produces monthly unemployment data for the state by place of residence. The LAUS program is a federal-state cooperative. The estimates include data from the Current Population Survey (CPS), a sample of over 600 households each month that asks respondents about their labor force status, along with data from the employer survey the Current Employment Statistics (CES) and data from the unemployment insurance system. CT DOL then publishes the unemployment rate. For more information on the LAUS program click here.
What does it mean to be unemployed and collect benefits?
The unemployment rate (most commonly reported) is calculated by taking the number or individuals who are unemployed but actively seeking work over the total number of people in the labor force. To be considered in the labor force one must be employed or unemployed but actively seeking work. (There are a total of six unemployment rates that are calculated but only one tends to be widely reported in the media. For example, there are other rates that include in the calculation underemployed or the unemployed who have stopped looking.)
To collect unemployment benefits an individual must have worked a minimum length of time in a job covered by unemployment insurance – that is your employer paid unemployment insurance taxes.
2017 at-a-glance
Depending on the data source used, the 2017 unemployment rate ranges from 4.0% to 4.7%. Of the three tools tracking unemployment that are mentioned here:
the American Community Survey yields the lowest value, with an estimated 2017 unemployment rate of 4.0%,
followed by IRS Form 1040 (4.4%), and
CT DOL (4.7%).
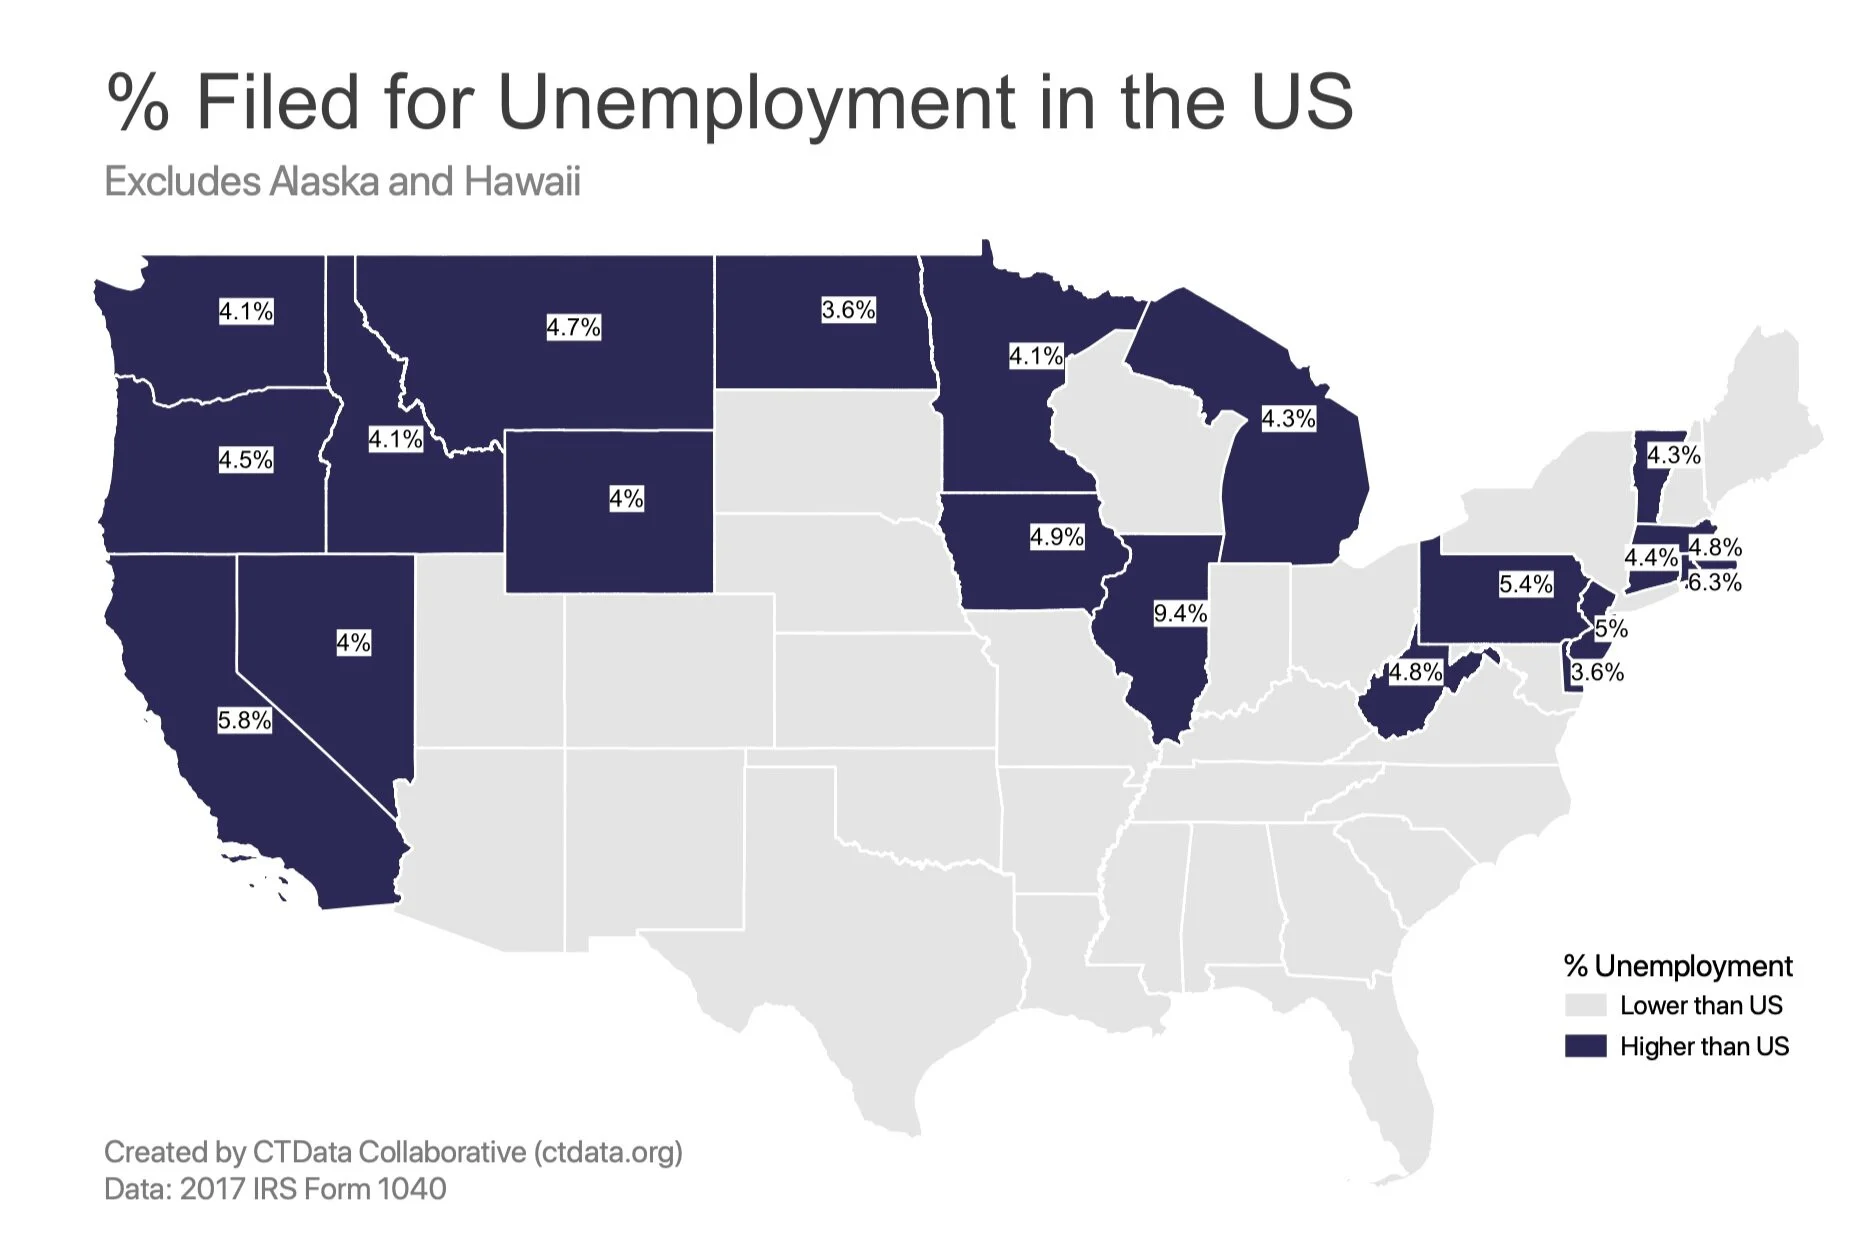
According to the 2017 IRS Form 1040 data, Connecticut ranked 11th in the nation for taxpayers receiving and claiming unemployment benefits (4.4%), which is higher than the national average of 3.4%. Nineteen other states had unemployment rates above the national average (highlighted in dark blue), with nearly half of those states located on the West coast. (Note that Alaska was excluded from this analysis, since their unemployment data includes a program called the Alaska Permanent Fund.)
Since eligibility for benefits varies from state-to-state, Connecticut’s rate could be higher because it allows more people benefits as compared to other states. Another reason could be that we have higher percentage of the workforce that is working for employers that pay unemployment insurance.
Why are rates different depending on the source?
Although the differences are small it’s important to realize that each source collects the data slightly differently thus yielding different results. The American Community Survey is a survey of households conducted throughout the year and then an estimate is calculated from 60 months of data. Data on unemployment is self-reported and could be affected by seasonal unemployment changes (for example, a student looking for work after completing a semester could complete the survey as unemployed until they find an internship, however, would not be collecting unemployment benefits).
The reported rate by the Department of Labor is also collected via a survey which means it is also self-reported unemployment and also collected on a monthly basis. However monthly rates are calculated and unadjusted and seasonally adjusted rates are published.
The IRS data captures individuals who received unemployment benefits. Thus the data only would include those eligible to receive benefits. However, there are people who are unemployed and not collecting benefits, such as self-employed individuals, and therefore would not be counted in the IRS data.
2007-2017 trends
To explore the potential impact of the great recession of 2007 in Connecticut, we also looked at trends in the unemployment rate over time. While the actual rate is slightly higher in Connecticut, the overall trend for taxpayers receiving unemployment compensation follows the national trend. As you can see in the figure, unemployment was on the rise between 2007 and 2010, and has steadily declined since 2010, regardless of data source. At its peak in 2010, 13.5% of CT taxpayers and 10.5% of US taxpayers were claiming unemployment, according to the ACS.

Why are there differences in reported unemployment?
As you can see from the data above, each source provides a slightly different rate as a result of how the data are collected -- the ACS estimated the unemployment rate of 4.0% while the 2017 unemployment rate from CT DOL was 4.7%. In 2017, 89,718 people in Connecticut were unemployed according to the DOL data while 77,010 tax returns claimed unemployment.
As noted above, eligibility depends on many factors. But we do know that there unemployed individuals who never receive unemployment and there might be people who are eligible who don’t claim it.
Like with income in Part 1 of this series, upon closer examination, it is clear that the differences in unemployment between the three sources are not due to errors in the data but rather how the data is collected and reported. For example:
Motivations for reporting accurate income data is different for IRS Form 1040, which is verified and audited by the government, versus the ACS and CPS which are surveys and not verified.
IRS Form 1040 only captures income data from tax filers whose gross income is above previously defined thresholds while there are no income thresholds for completing the ACS or reporting to the Department of Labor LAUS.
Question wording used to inquire about employment status varies, with DOL/CPS using the most detailed criteria (Kromer & Howard, 2011).