
New Census Bureau Data on Young Adult Migration: Connecticut Experiences More Out-Migration than In-Migration of Young Adults, with Rates Varying by Parental Income and Race/Ethnicity
On July 25th, the U.S. Census Bureau in collaboration with Harvard University released a new interactive data tool on young adult migration. The data tool tracks patterns of migration between all 741 commuting zones in the U.S. from childhood (measured at age 16) to young adulthood (measured at age 26), for individuals with a Social Security Number who were born in the U.S. between 1984 and 1992. Thus, the sample includes individuals who were 16 years old in 2000-2008 and who were 26 years old in 2010-2018.
The data were compiled by linking tax data from the IRS and housing data from the Department of Housing and Urban Development with demographic information from the Decennial Census and the American Community Survey. Migration patterns are provided for the full sample and disaggregated by parental income quintile and by four categories of race and ethnicity (Hispanic, non-Hispanic Asian, non-Hispanic Black, and non-Hispanic White).
Importantly, the data exclude individuals who migrated internationally and those who are undocumented, as well as any individuals who could not be linked to parents, a parental location at age 14-18 years old, and a location at age 26.
In total, the sample included roughly 87% of all Social Security Number holders who were born in the U.S. between 1984 and 1992.
The data tool treats all of Connecticut as one commuting zone, following the commuting zones established by the USDA Economic Research Service. Although this commuting zone is labeled in the interactive data tool as “Bridgeport, CT,” it is the only commuting zone in Connecticut and includes individuals living anywhere in the state.
Researchers at Harvard University and the U.S. Census Bureau used these data to conduct a study of young adult migration patterns. They found that, nationally, 69% of 26-year-olds in 2010-2018 lived in the same commuting zone where they resided at age 16, and 80% traveled fewer than 100 miles away.
Below we report some findings from the tool on migration patterns for Connecticut residents.
30% of Connecticut’s 16-year-olds lived in another state at age 26.
The data show that 70% of 16-year-olds living in Connecticut in 2000-2008 were living in the state at age 26 (in 2010-2018) and about 30% had moved to another state. This is similar to the national average of 69% of young adults living in the same commuting zone that they grew up in. However, most other states include multiple commuting zones and some commuting zones cross state lines, meaning that these numbers should not be interpreted as indicating similar rates of migration across state lines.
For the 30% of 16-year-olds who were living outside Connecticut at age 26, the five top destination commuting zones were:
New York City (5.0%)
Boston, MA (4.0%)
Washington, DC (1.3%)
Los Angeles, CA (1.0%)
Providence, RI (0.8%)
18% of Connecticut’s 26-year-olds had lived in another state when they were 16.
The data show that 82% of the 26-year-olds living in Connecticut in 2010-2018 had been living in Connecticut when they were 16 years old, and 18% had moved from another state.
For the 18% of individuals who had moved from another state, the top five commuting zones they had moved from were:
New York City (3.1%)
Boston, MA (1.4%)
Newark, NJ (0.9%)
Providence, RI (0.8%)
Springfield, MA (0.8%)
Domestic migration of young adults from Connecticut was two times higher than domestic migration to Connecticut.
In total, the database tracked roughly 112,000 individuals who had moved from Connecticut to another state between the ages of 16 and 26, and 56,000 individuals who had moved to Connecticut from another state between the ages of 16 and 26. This implies that the domestic outflow of young adults from Connecticut was two times higher than the domestic inflow of young adults in that same period.
To contextualize this number, we calculated the domestic outflow and inflow of young adults from/to commuting zones located primarily in four nearby states: Massachusetts, Rhode Island, New York, and New Jersey.
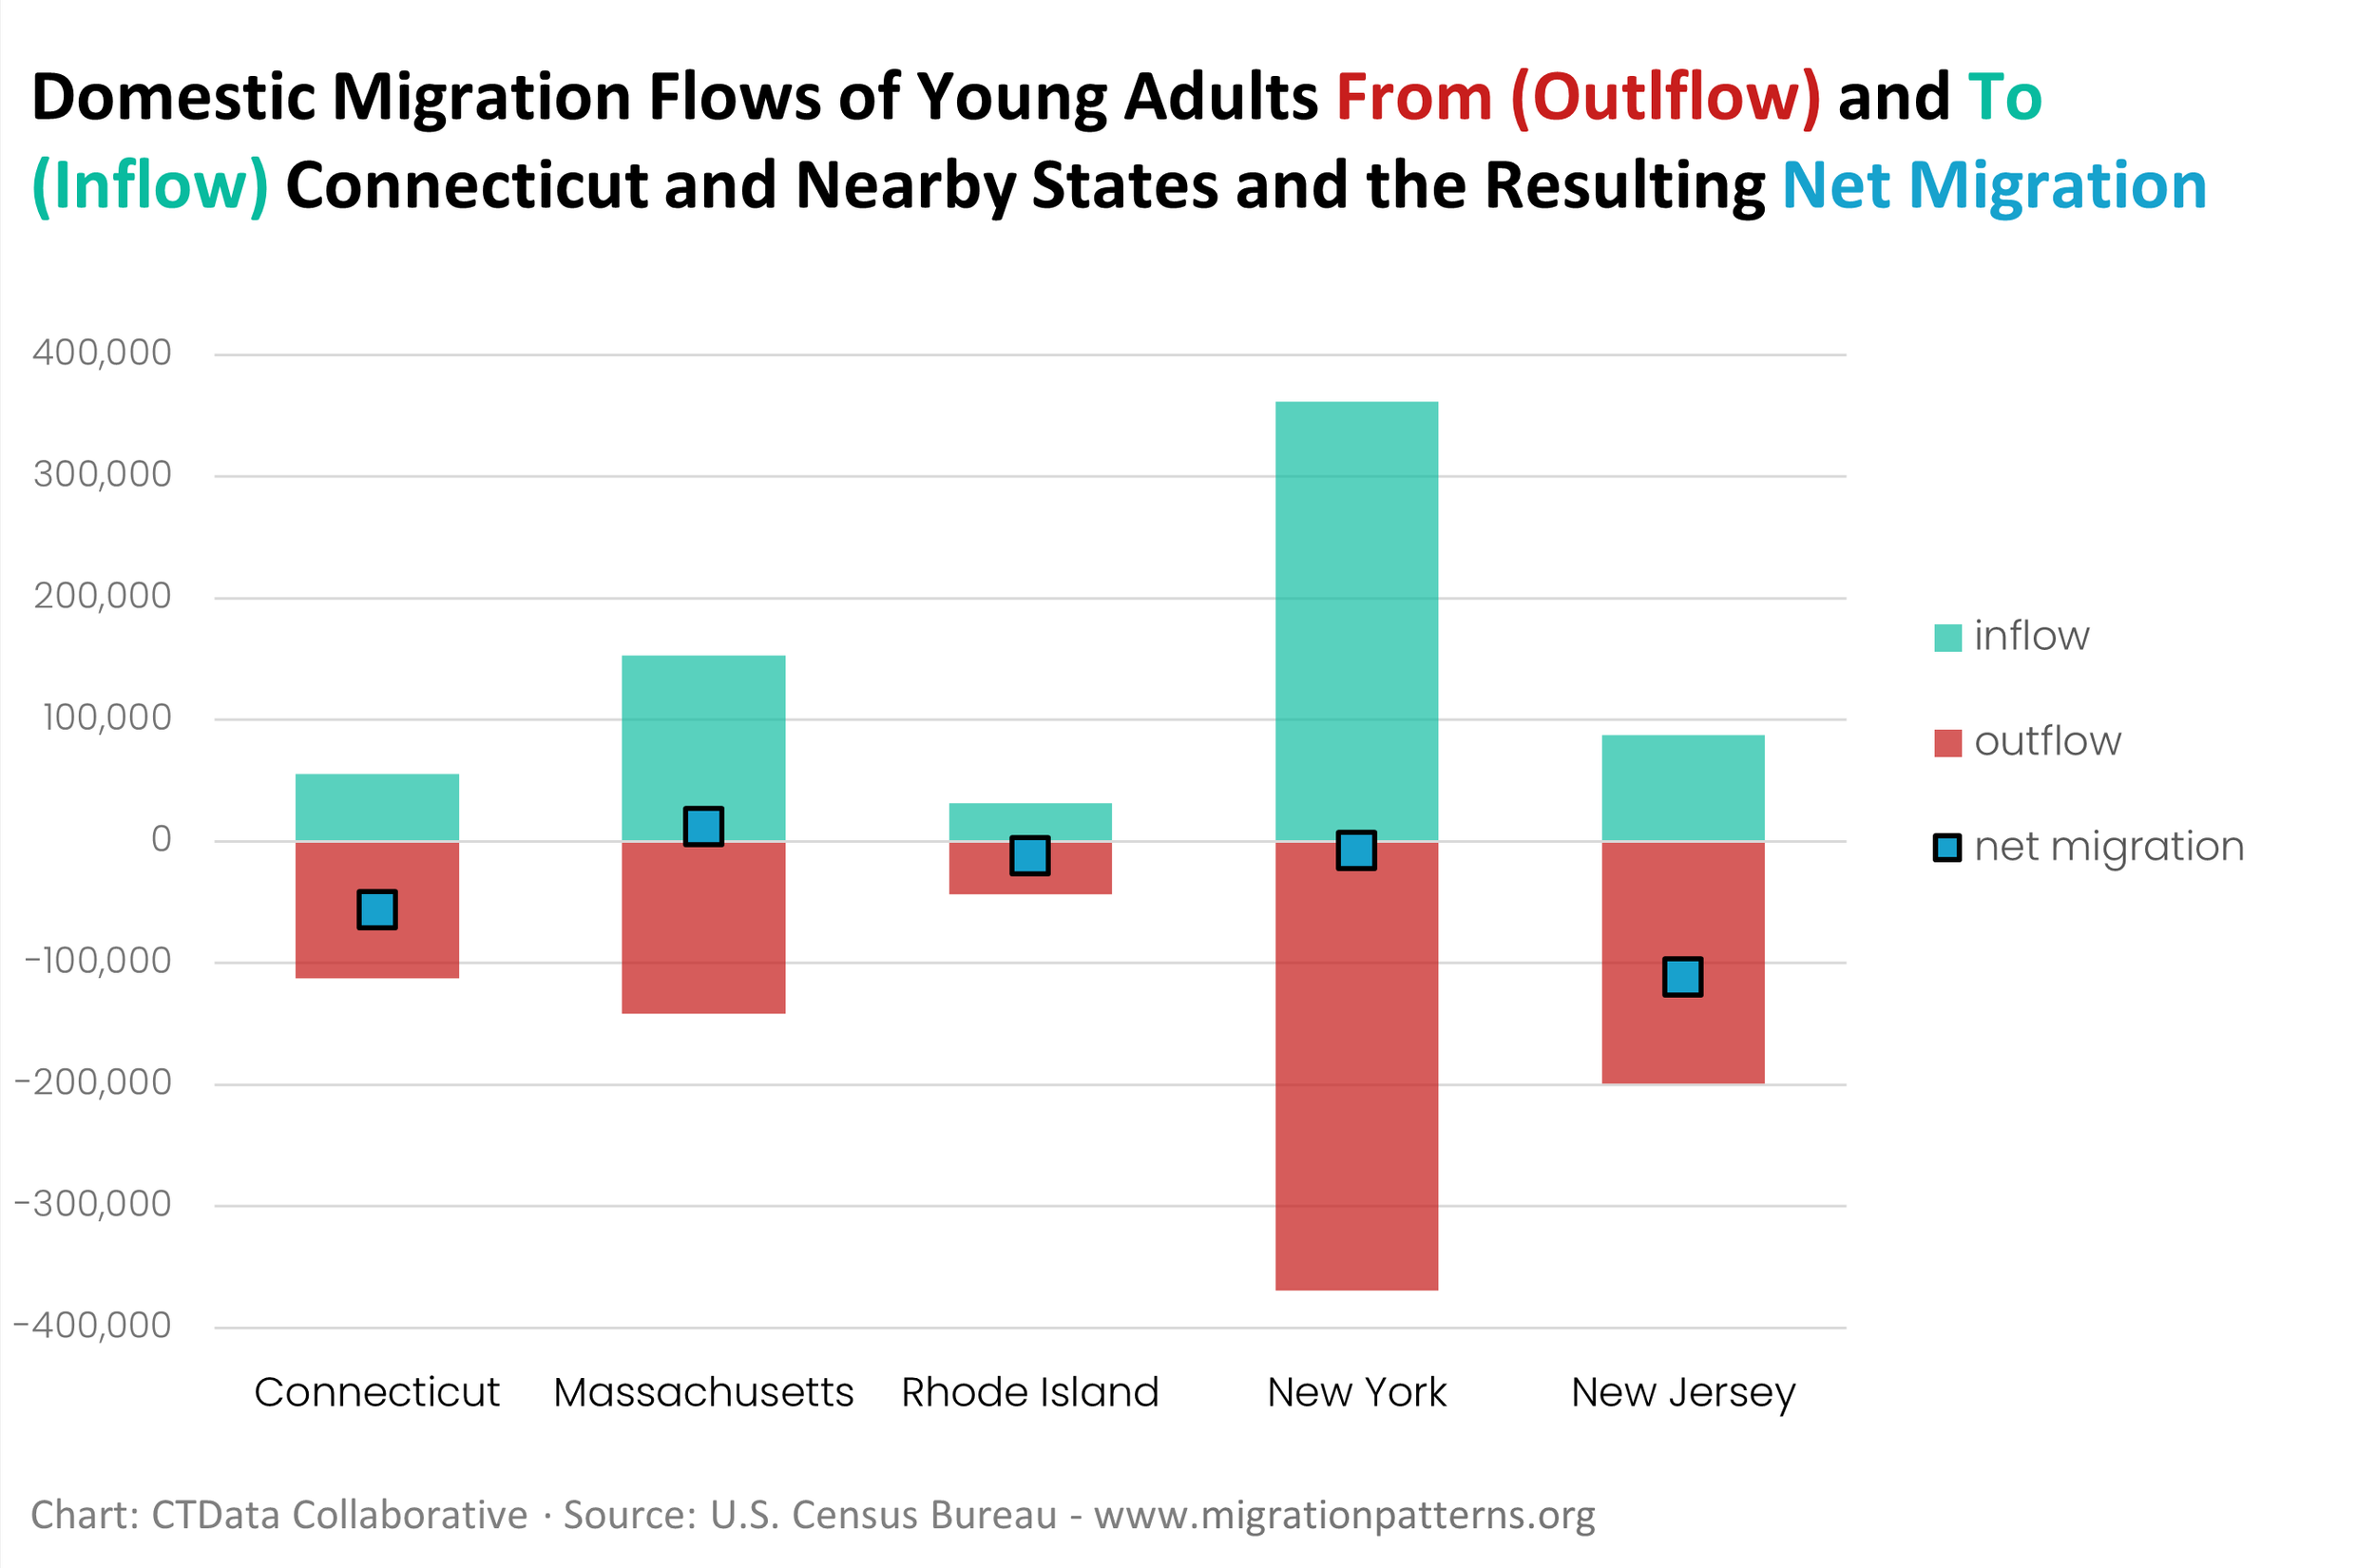
Only New Jersey had a larger ratio of outflow to inflow: 2.3 times as many individuals moved from versus to New Jersey commuting zones between the ages of 16 and 26. In Rhode Island, the outflow was 1.4 times larger than the inflow, and in Massachusetts and New York the ratio of outflow to inflow was close to one (i.e., net migration was close to zero).
Importantly, these numbers ignore international migration. Our prior in-depth report on migration data from 2001 to 2016, conducted in collaboration with the CT Office of Policy Management, showed that Connecticut experienced net positive international migration and net negative domestic migration across all age groups, including among young adults. Thus, migration of young adults into Connecticut from international origins likely partially offsets the domestic outflow in this age range.
Furthermore, the young adult migration data tool does not address the number of individuals who move to Connecticut later in adulthood. Our migration report also showed a net negative migration of young adults from Connecticut but a net positive migration of prime working-age adults (ages 30-49) into Connecticut, particularly during the post-recession years of 2012-2015. Thus, these trends may shift later in adulthood.
Young adults from the highest-income families were the most likely to move to another state.
Young adults whose parents’ income was in the top 20th percentile during their childhood had by far the highest rate of domestic migration out of Connecticut – 41% were living in another state at age 26, versus about 25% of those whose parents’ income was in the middle or second-highest quintiles.
Young adults raised in families whose income was in the bottom 20th percentile had the lowest rate of out-migration – only 20% were living in another state at age 26.
This pattern mirrors national trends. Nationally, the data show that young adults from the highest-income families traveled much farther than those from lower-income families. Those from families at the 90th income percentile traveled an average of 220 miles, versus 160 miles for those at the 25th percentile. This means that young adults from low-income families are more strongly exposed to the labor market conditions of the region where they grew up.
In contrast, the proportion of Connecticut’s 26-year-olds who had moved to the state since they were 16 was essentially the same across parental income levels. About 16% - 19% of Connecticut’s 26-year-olds from each parental income quintile had lived in another state at age 16.
Black and Hispanic young adults were less likely to move to another state.
Only about 20% of Black and Hispanic 16-year-olds from Connecticut were living in another state at age 26, versus 33% of White young adults and 36% of Asian young adults.
This also mirrors national trends. Nationally, the data show that Black young adults had moved about 130 miles and Hispanic young adults had moved about 144 miles from the commuting zone where they grew up, versus 190 miles for White young adults and 223 miles for Asian young adults.
Racial disparities in out-migration were present across all parental income levels.
In Connecticut, being from a high-income family predicted much higher rates of domestic out-migration for young adults from each racial and ethnic group. However, racial disparities in rates of domestic out-migration were present within each parental income quintile.

Within each parental income quintile, Hispanic young adults’ rates of out-migration were between 4 and 6 percentage-points lower than those for White young adults.
In contrast, the gap in out-migration rates between Black young adults and both White and Hispanic young adults increased at the highest parental income quintile. In the first through fourth parental income quintiles, there was a 5 to 7 percentage-point gap between Black and White young adults in out-migration rates, and rates were very similar between Black and Hispanic young adults. However, at the top parental income quintile, Black young adults’ rate of out-migration was 12 percentage-points lower than that for White young adults and 6 percentage-points lower than that for Hispanic young adults.
In contrast, Asian young adults showed substantially higher out-migration rates than all other racial and ethnic groups at all parental income levels except for the top quintile, where their out-migration rates were similar to those of White young adults.
Interested in Learning More?
Use the interactive data tool to explore domestic migration patterns for young adults across the country. You can also check out the Census Bureau’s “America Counts” story on the data tool and research findings, and read the full research report by Harvard University and Census Bureau researchers. In addition to exploring national migration patterns, this research report analyzes how migration responds to local wage growth.
To learn more about migration in Connecticut, see our in-depth analysis of migration data from 2001-2016 conducted in collaboration with the CT Office of Policy Management.